

2026 Updated Verified Pass Analytics-Con-301 Exam - Real Questions and Answers
Dumps Moneyack Guarantee - Analytics-Con-301 Dumps Approved Dumps
NEW QUESTION # 37
A consultant is designing a dashboard that will be consumed on desktops, tablets, and phones. The consultant needs to implement a dashboard design that provides the best user experience across all the platforms.
Which approach should the consultant take to achieve these results?
- A. Build one dashboard and fix the size of the dashboard.
- B. Build one dashboard and set the size to Automatic.
- C. Build one dashboard that has desktop, tablet, and phone layouts, and fix the size of the layouts.
- D. Build one dashboard for each type of device and fix the size of the layouts.
Answer: C
Explanation:
For a consultant designing a dashboard to be consumed across multiple device types, the best approach is:
Multi-device Layout: Tableau provides the capability to design device-specific layouts within a single dashboard. This feature allows the dashboard to adapt its layout to best fit the screen size and orientation of desktops, tablets, and phones.
Fixed Size Layouts: By fixing the size of each layout, the consultant can ensure that the dashboard appears consistent and maintains the intended design elements and user experience across devices. Fixed sizes prevent components from resizing in ways that could disrupt the dashboard's readability or functionality.
Implementation: In Tableau, you can create these layouts by selecting 'Device Preview' and adding custom layouts for each device type. Here, you define the dimensions and the positioning of sheets and controls tailored to each device's typical viewing mode.
References
This approach leverages Tableau's device designer capabilities, which are specifically designed to optimize dashboards for multiple viewing environments, ensuring a seamless user experience regardless of the device used. This functionality is well documented in Tableau's official guides on creating and managing device-specific dashboards.
NEW QUESTION # 38
From the desktop, open the CC workbook.
Open the Incremental worksheet.
You need to add a line to the chart that
shows the cumulative percentage of sales
contributed by each product to the
incremental sales.
From the File menu in Tableau Desktop, click
Save.
Answer:
Explanation:
See the complete Steps below in Explanation:
Explanation:
To add a line showing the cumulative percentage of sales contributed by each product to the incremental sales in the Incremental worksheet of your Tableau Desktop, follow these detailed steps:
* Open the CC Workbook and Access the Worksheet:
* From the desktop, double-click on the CC workbook to open it in Tableau Desktop.
* Navigate to the Incremental worksheet by clicking on its tab at the bottom of the window.
* Calculate Cumulative Sales Percentage:
* Create a new calculated field to compute the cumulative percentage of sales. Right-click in the Data pane and select 'Create Calculated Field'.
* Name this field "Cumulative Sales Percentage".
* Enter the following formula to calculate the running sum of sales as a percentage of the total sales:
(RUNNING_SUM(SUM([Sales])) / TOTAL(SUM([Sales])) [Sales]))
* Click 'OK' to save the calculated field.
* Add the Cumulative Sales Percentage Line to the Chart:
* Drag the "Cumulative Sales Percentage" field to the Rows shelf, placing it next to the existing Sales measure.
* Ensure that the cumulative line appears as a continuous line. Right-click on the "Cumulative Sales Percentage" field on the Rows shelf, select 'Change Chart Type', and choose 'Line'.
* Adjust the axis to synchronize or dual-axis if necessary. Right-click on the axis of the
"Cumulative Sales Percentage" and select 'Synchronize Axis' if it's on a dual-axis setup.
* Format the Cumulative Sales Percentage Line:
* Click on the "Cumulative Sales Percentage" line in the visualization.
* Navigate to the 'Format' pane to adjust the line style, thickness, and color to make it distinct from other data in the chart.
* Save Your Changes:
* From the File menu, click 'Save' to ensure all your changes are stored.
References:
Tableau Help: Provides additional details on creating calculated fields and customizing line charts.
Tableau User Guide: Offers extensive instructions on formatting charts, including line types and axis synchronization.
By following these steps, you will successfully add a cumulative sales percentage line to your chart, enhancing the visualization to reflect the incremental contribution of each product to the overall sales in a dynamic and informative manner.
NEW QUESTION # 39
An online sales company has a table data source that contains Order Date. Products ship on the first day of each month for all orders from the previous month.
The consultant needs to know the average number of days that a customer must wait before a product is shipped.
Which calculation should the consultant use?
- A. Calc1: DATETRUNC ('month', DATEADD ('month', 1, [Order Date]))
Calc2: AVG(DATEDIFF ('day', [Order Date], [Calc1])) - B. Calc1: DATETRUNC ('day', DATEADD ('day', 31, [Order Date]))
Calc2: AVG ([Order Date] - [Calc1]) - C. Calc1: DATETRUNC ('day', DATEADD('week', 4, [Order Date]))
Calc2: AVG([Order Date] - [Calc1]) - D. Calc1: DATETRUNC ('month', DATEADD('month', 1, [Order Date]))
Calc2: AVG(DATEDIFF ('week', [Order Date], [Calc1]))
Answer: A
Explanation:
The correct calculation to determine the average number of days a customer must wait before a product is shipped is to first find the shipping date, which is the first day of the following month after the order date.
This is done using DATETRUNC('month', DATEADD('month', 1, [Order Date])). Then, the average difference in days between the order date and the shipping date is calculated using AVG(DATEDIFF('day',
[Order Date], [Calc1])). This approach ensures that the average wait time is calculated in days, which is the most precise measure for this scenario.
References: The solution is based on Tableau's date functions and their use in calculating differences between dates, which are well-documented in Tableau's official learning resources and consultant documents12.
To calculate the average waiting days from order placement to shipping, where shipping occurs on the first day of the following month:
Calculate Shipping Date (Calc1): Use the DATEADD function to add one month to the order date, then apply DATETRUNC to truncate this date to the first day of that month. This represents the shipping date for each order.
Calculate Average Wait Time (Calc2): Use DATEDIFF to calculate the difference in days between the original order date and the calculated shipping date (Calc1). Then, use AVG to average these differences across all orders, giving the average number of days customers wait before their products are shipped.
References:
Date Functions in Tableau: Functions like DATEADD, DATETRUNC, and DATEDIFF are used to manipulate and calculate differences between dates, crucial for creating metrics that depend on time intervals, such as customer wait times in this scenario.
NEW QUESTION # 40
A transport and delivery company uses a command center dashboard in its logistics and distribution hubs. The dashboard is displayed on screens to show fleet movements, delivery status, and warehouse operations. The company needs the dashboard to provide up-to-date information without human intervention. The company's environment cannot access the internet, and the data source is configured to maintain a real-time connection.
How should the company meet this requirement?
- A. Configure the data source to extract instead of live. Schedule the extract refresh of data at regular intervals.
- B. Search and download a suitable sandboxed dashboard extension from Tableau Exchange to refresh the dashboard at regular intervals.
- C. Build a web app with dashboard extension API that refreshes the dashboard at regular intervals. Host the web app on the company's web server.
- D. Schedule a prep flow to refresh the dashboard at regular intervals.
Answer: C
Explanation:
Comprehensive and Detailed Explanation From Exact Extract:
Key details from the scenario:
* The dashboard is on a command center screen.
* The environment cannot access the internet.
* The data source is real-time (live).
* The dashboard must keep itself refreshed automatically.
* No human interaction should be required.
From Tableau's documentation:
# Dashboard Extension API
Tableau's Extension API allows developers to create custom extensions that can automate refreshing a live dashboard at intervals.
The extension is hosted on the company's internal web server, which solves the "no internet access" limitation.
This is the only method in the listed options that:
* Works offline
* Can auto-refresh the dashboard
* Supports a "screen-based" live monitoring use case
* Uses the existing live connection (no need for extracts)
Thus, A is correct.
Why the other options are wrong:
# B. Schedule a Prep Flow
Prep flows do not refresh dashboards.
They only refresh prepared data sources.
The dashboard still won't auto-update unless reopened.
# C. Download an extension from Tableau Exchange
Tableau Exchange requires internet access, which the company does not have.
Also, "sandboxed extensions" cannot refresh the dashboard at timed intervals.
# D. Use extracts and scheduled extract refresh
Extracts require:
* A Tableau Server / Cloud schedule
* Internet access for Cloud
* And extracts are not real-timeThis contradicts the requirement for real-time data and an offline environment.
NEW QUESTION # 41
A client has a sales dataset that contains fields named Customer ID, Region, Item, and Sales Amount. Each row represents a single sale. There may be multiple sales for each Customer ID.
The client wants to visualize the average total customer sales by region.
Which Level of Detail (LOD) expression should a consultant recommend?
- A. AVG({FIXED [Customer ID], [Region]: SUM([Sales Amount])})
- B. {FIXED [Customer ID], [Region]: AVG([Sales Amount])}
- C. AVG({EXCLUDE [Region]: SUM([Sales Amount])})
- D. {FIXED [Region]: AVG([Sales Amount])}
Answer: A
Explanation:
Comprehensive and Detailed Explanation From Exact Extract:
The requirement is:
* Compute total sales per customer, not per transaction.
* Then compute the average of those customer totals, grouped by region.
Tableau documentation states that FIXED LOD expressions are used to calculate values at a specific level of granularity regardless of the view.
To solve the business need:
Step 1:
Calculate total customer sales for each Customer ID within each Region:
{ FIXED [Customer ID], [Region] : SUM([Sales Amount]) }
This produces one number per customer per region.
Step 2:
Compute the average of those totals:
AVG( { FIXED [Customer ID], [Region] : SUM([Sales Amount]) } )
This yields:
Average total customer sales by region
This is exactly option C.
Why the other options are incorrect:
* A. EXCLUDE Region: Would combine regions and incorrectly calculate overall totals.
* B. FIXED Region: AVG(Sales Amount): Computes average of line-level sales, not customer totals.
* D. FIXED Customer ID + Region: AVG(Sales Amount): Averages individual transactions, not customer totals.
Only option C matches the required two-step logic.
* LOD Expressions: FIXED for computing customer-level aggregates.
* Nested LOD usage for first calculating customer totals, then averaging them at a higher level.
* Tableau guidance: SUM inside FIXED for per-customer totals, AVG outside for averaging customers.
NEW QUESTION # 42
An analyst needs to interactively set a reference date to drive table calculations without leaving a view.
Which action should the analyst use?
- A. Running action
- B. Parameter action
- C. Highlight action
- D. Filter action
Answer: B
Explanation:
Comprehensive and Detailed Explanation From Exact Extract:
Tableau's documentation on Parameter Actions states that they allow users to interactively update a parameter directly from the view-without opening the parameter control box.
To "interactively set a reference date" that drives a table calculation:
* A parameter must hold that reference date.
* A parameter action allows clicking or selecting a mark in the view to update the parameter value.
* Table calculations can then reference that parameter to change their computation dynamically.
Filter actions modify which data is shown, not a reference date.
Running actions change sheets, not computation parameters.
Highlight actions visually accent marks but do not set values.
Thus, parameter actions are the only mechanism that meets the requirement.
* Parameter Actions overview describing interactive parameter updates.
* Use cases where parameter actions drive table calculations.
* Action type comparison showing that only parameter actions update a computation value.
NEW QUESTION # 43
A client uses Tableau Data Management and notices that when they view a data source, they sometimes see a different count of workbooks in the Connected Workbooks tab compared to the lineage count in Tableau Catalog.
What is the cause of this discrepancy?
- A. Some workbooks have been connected to the data source, but do not use any fields from it.
- B. Some of the workbooks connected to the data source are not visible to the user due to permissions.
- C. Some workbooks have not been viewed by enough users yet.
- D. Some Creators have connected to the data source in Tableau Desktop but have not yet published a workbook.
Answer: B
Explanation:
The discrepancy between the count of workbooks in the Connected Workbooks tab and the lineage count in Tableau Catalog can occur because of user permissions. In Tableau Data Management, the visibility of connected workbooks is subject to the permissions set by administrators. If a user does not have permission to view certain workbooks, they will not see them listed in the Connected Workbooks tab, even though these workbooks are part of the data source's lineage and are counted in Tableau Catalog.
References: This explanation is based on the functionality of Tableau Data Management and Tableau Catalog, which includes managing user permissions and access to workbooks. The information is supported by Tableau's official documentation on data management and security practices1.
NEW QUESTION # 44
A consultant is tasked with improving the performance of a large workbook that contains multiple dashboards, each of which leverages a separate data source. What is one way to improve performance?
- A. Convert any extracted data sources to live data sources.
- B. Split the workbook into multiple workbooks.
- C. Restrict the users who can access the workbook.
- D. Convert Data Source filters to Quick Filters.
Answer: B
Explanation:
Comprehensive and Detailed Explanation From Exact Extract:
Tableau's performance best-practice documentation explains that large workbooks containing many dashboards, multiple data sources, and complex interactions have heavier memory and CPU requirements. When a workbook grows too large, Tableau must:
* Load every data source
* Cache metadata for all sheets
* Maintain connections across all dashboards
* Render more worksheets simultaneously
This increases workbook load time and slows dashboard performance.
A documented method for improving performance is to split a large workbook into multiple smaller workbooks, each containing only the dashboards relevant to a particular audience or subject area. Smaller workbooks:
* Reduce the amount of metadata Tableau must load
* Reduce extract sizes per workbook
* Improve caching efficiency
* Improve dashboard loading and rendering time
Options A, B, and C do not improve workbook performance:
* A. Converting Data Source Filters to Quick Filters reduces performance because Quick Filters (interactive filters) are more expensive than Data Source filters and slow down rendering.
* B. Converting extracts to live connections typically worsens performance because live sources depend on database query speed, network latency, and server load.
* C. Restricting users does not change workbook performance, only access.
Splitting the workbook is a recognized Tableau strategy for improving performance of large, multi-dashboard workbooks.
* Tableau Performance Optimization guidelines encouraging splitting large workbooks into smaller ones.
* Workbook design best practices emphasizing reduced complexity and smaller metadata footprints.
* Documentation on performance costs associated with Quick Filters and multiple data sources.
NEW QUESTION # 45
SIMULATION
From the desktop, open the CC workbook. Use the US Population Estimates data source.
You need to shape the data in US Population Estimates by using Tableau Desktop. The data must be formatted as shown in the following table.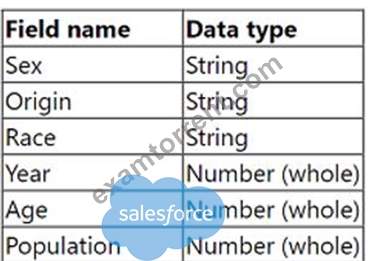
Open the Population worksheet. Enter the total number of records contained in the data set into the Total Records parameter.
From the File menu in Tableau Desktop, click Save.
Answer:
Explanation:
See the complete Steps below in Explanation
Explanation:
To shape the data in the "US Population Estimates" data source and enter the total number of records into the "Total Records" parameter in Tableau Desktop, follow these steps:
Open the CC Workbook and Access the Worksheet:
From the desktop, double-click on the CC workbook to open it in Tableau Desktop.
Navigate to the Population worksheet by selecting its tab at the bottom of the window.
Format and Shape the Data:
Ensure the data types match those specified in the requirements: Sex, Origin, Race as strings; Year, Age, Population as whole numbers.
To verify or change the data type, click on the dropdown arrow next to each field name in the Data pane and select "Change Data Type" if necessary.
Calculate Total Number of Records:
Create a new calculated field named "Total Records". To do this, right-click in the Data pane and select "Create Calculated Field".
Enter the formula COUNT([Record ID]) or SUM([Number of Records]) depending on how the data source identifies each row uniquely.
Drag this new calculated field onto the worksheet to display the total number of records.
Enter the Value into the Total Records Parameter:
Locate the "Total Records" parameter in the Data pane. Right-click on the parameter and select "Edit".
Manually enter the number displayed from the calculated field into the parameter, ensuring accuracy to meet the data shaping requirement.
Save Your Changes:
From the File menu, click 'Save' to ensure all your changes are stored.
References:
Tableau Desktop Guide: Provides detailed instructions on managing data types, creating calculated fields, and updating parameters.
Tableau Data Shaping Techniques: Outlines effective methods for manipulating and structuring data for analysis.
This process will ensure the data in the "US Population Estimates" is accurately shaped according to the specified format and that the total number of records is correctly calculated and entered into the designated parameter. This thorough approach ensures data integrity and accuracy in reporting.
NEW QUESTION # 46
SIMULATION
From the desktop, open the CC workbook.
Open the Incremental worksheet.
You need to add a line to the chart that
shows the cumulative percentage of sales
contributed by each product to the
incremental sales.
From the File menu in Tableau Desktop, click
Save.
Answer:
Explanation:
See the complete Steps below in Explanation
Explanation:
To add a line showing the cumulative percentage of sales contributed by each product to the incremental sales in the Incremental worksheet of your Tableau Desktop, follow these detailed steps:
Open the CC Workbook and Access the Worksheet:
From the desktop, double-click on the CC workbook to open it in Tableau Desktop.
Navigate to the Incremental worksheet by clicking on its tab at the bottom of the window.
Calculate Cumulative Sales Percentage:
Create a new calculated field to compute the cumulative percentage of sales. Right-click in the Data pane and select 'Create Calculated Field'.
Name this field "Cumulative Sales Percentage".
Enter the following formula to calculate the running sum of sales as a percentage of the total sales:
(RUNNING_SUM(SUM([Sales])) / TOTAL(SUM([Sales])) [Sales]))
Click 'OK' to save the calculated field.
Add the Cumulative Sales Percentage Line to the Chart:
Drag the "Cumulative Sales Percentage" field to the Rows shelf, placing it next to the existing Sales measure.
Ensure that the cumulative line appears as a continuous line. Right-click on the "Cumulative Sales Percentage" field on the Rows shelf, select 'Change Chart Type', and choose 'Line'.
Adjust the axis to synchronize or dual-axis if necessary. Right-click on the axis of the "Cumulative Sales Percentage" and select 'Synchronize Axis' if it's on a dual-axis setup.
Format the Cumulative Sales Percentage Line:
Click on the "Cumulative Sales Percentage" line in the visualization.
Navigate to the 'Format' pane to adjust the line style, thickness, and color to make it distinct from other data in the chart.
Save Your Changes:
From the File menu, click 'Save' to ensure all your changes are stored.
References:
Tableau Help: Provides additional details on creating calculated fields and customizing line charts.
Tableau User Guide: Offers extensive instructions on formatting charts, including line types and axis synchronization.
By following these steps, you will successfully add a cumulative sales percentage line to your chart, enhancing the visualization to reflect the incremental contribution of each product to the overall sales in a dynamic and informative manner.
NEW QUESTION # 47
A client has a database that stores widget inventory by day and it is updated on a nonstandard schedule as shown below.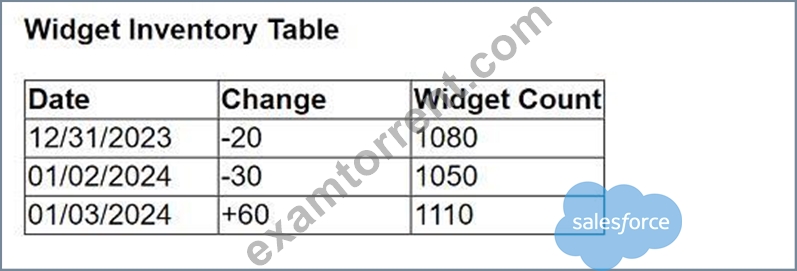
They want a data visualization that shows widget inventory daily, however their business unit does not have the ability to modify the data warehouse structure.
What should the client do to achieve the desired result?
- A. Create a temporary table in the database.
- B. Update the Widget Inventory Table to be a daily snapshot.
- C. Use Tableau Prep to add new rows.
- D. Use Tableau Desktop to visualize null values.
Answer: C
Explanation:
For a client who needs a daily visualization of widget inventory but cannot modify the data warehouse structure, the best approach is to use Tableau Prep to add new rows. Tableau Prep can be used to manipulate the existing dataset by adding missing date entries and appropriately adjusting inventory counts based on available data. This allows the creation of a complete daily snapshot for visualization without needing changes to the underlying database structure.
NEW QUESTION # 48
From the desktop, open the CC workbook. Use the US Population Estimates data source.
You need to shape the data in US Population Estimates by using Tableau Desktop. The data must be formatted as shown in the following table.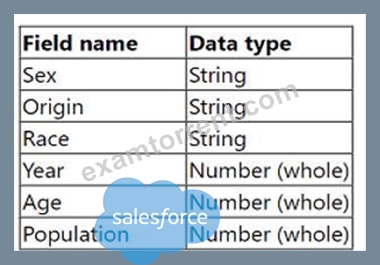
Open the Population worksheet. Enter the total number of records contained in the data set into the Total Records parameter.
From the File menu in Tableau Desktop, click Save.
Answer:
Explanation:
See the complete Steps below in Explanation:
Explanation:
To shape the data in the "US Population Estimates" data source and enter the total number of records into the
"Total Records" parameter in Tableau Desktop, follow these steps:
* Open the CC Workbook and Access the Worksheet:
* From the desktop, double-click on the CC workbook to open it in Tableau Desktop.
* Navigate to the Population worksheet by selecting its tab at the bottom of the window.
* Format and Shape the Data:
* Ensure the data types match those specified in the requirements: Sex, Origin, Race as strings; Year, Age, Population as whole numbers.
* To verify or change the data type, click on the dropdown arrow next to each field name in the Data pane and select "Change Data Type" if necessary.
* Calculate Total Number of Records:
* Create a new calculated field named "Total Records". To do this, right-click in the Data pane and select "Create Calculated Field".
* Enter the formula COUNT([Record ID]) or SUM([Number of Records]) depending on how the data source identifies each row uniquely.
* Drag this new calculated field onto the worksheet to display the total number of records.
* Enter the Value into the Total Records Parameter:
* Locate the "Total Records" parameter in the Data pane. Right-click on the parameter and select
"Edit".
* Manually enter the number displayed from the calculated field into the parameter, ensuring accuracy to meet the data shaping requirement.
* Save Your Changes:
* From the File menu, click 'Save' to ensure all your changes are stored.
References:
Tableau Desktop Guide: Provides detailed instructions on managing data types, creating calculated fields, and updating parameters.
Tableau Data Shaping Techniques: Outlines effective methods for manipulating and structuring data for analysis.
This process will ensure the data in the "US Population Estimates" is accurately shaped according to the specified format and that the total number of records is correctly calculated and entered into the designated parameter. This thorough approach ensures data integrity and accuracy in reporting.
NEW QUESTION # 49
A client notices that while creating calculated fields, occasionally the new fields are created as strings, integers, or Booleans. The client asks a consultant if there is a performance difference among these three data types.
What should the consultant tell the customer?
- A. Strings are fastest, followed by integers, and then Booleans.
- B. Strings, integers, and Booleans all perform the same.
- C. Integers are fastest, followed by Booleans, and then strings.
- D. Booleans are fastest, followed by integers, and then strings.
Answer: C
Explanation:
In Tableau, the performance of calculated fields can vary based on the data type used. Calculations involving integers and Booleans are generally faster than those involving strings. This is because numerical operations are typically more efficient for a computer to process than string operations, which can be more complex and time-consuming. Therefore, when performance is a consideration, it is advisable to use integers or Booleans over strings whenever possible.
References: The performance hierarchy of data types in Tableau calculations is documented in resources that discuss best practices for optimizing Tableau performance1.
NEW QUESTION # 50
A consultant used Tableau Data Catalog to determine which workbooks will be affected by a field change.
Catalog shows:
* Published Data Source # 7 connected workbooks
* Field search (Lineage tab) # 6 impacted workbooks
The client asks: Why 7 connected, but only 6 impacted?
- A. The field being altered is not used in the seventh workbook.
- B. The seventh workbook is connected via Custom SQL so it didn't appear in the list.
- C. The field is used twice in a single workbook.
- D. The consultant lacked sufficient permissions to see the seventh workbook.
Answer: A
Explanation:
Comprehensive and Detailed Explanation From Exact Extract:
Key Tableau Catalog behaviors:
* Connected workbooks = any workbook linked to the published data source.
* Impacted workbooks = only workbooks that use the specific field.
* If a workbook connects to the data source but never uses the field, it appears as "connected" but not impacted.
This explains EXACTLY why:
* 7 workbooks are connected
* Only 6 use the changed field
* Therefore only 6 are impacted
This matches Option C.
Why the other options are incorrect:
A). Field used twice
Still counts as one workbook - does not explain discrepancy.
B). Permission issue
If permissions blocked visibility, the data source would not list 7 connections.
D). Custom SQL use
Catalog can still detect field usage through metadata lineage; Custom SQL does NOT hide workbook dependency.
Thus, only Option C logically explains the scenario.
* Data Catalog lineage rules: "Connected vs. Impacted" distinction.
* Field-level impact analysis documentation.
* Workbook dependency logic within Tableau Catalog.
NEW QUESTION # 51
A consultant wants to improve the performance of reports by moving calculations to the data layer and materializing them in the extract.
Which type of calculation is the consultant able to move?
- A. A calculation that contains an aggregation
- B. A row-level calculation
- C. A calculation that contains table calculation functions
- D. A calculation that contains parameters
Answer: B
Explanation:
Comprehensive and Detailed Explanation From Exact Extract:
Tableau allows certain calculations to be materialized in extracts, meaning they are precomputed and stored inside the .hyper file to improve performance.
According to Tableau's extract documentation:
* Materializable calculations must be compatible with the extract engine and must not depend on dynamic, view-based, or post-query logic.
* Only row-level calculations and aggregation-level calculations without dependencies on runtime context can be materialized.
* Tableau cannot materialize any calculation containing:
* Table calculation functions
* Functions requiring post-aggregation logic
* View-dependent elements
* Parameters that need runtime evaluation
Evaluation of the choices:
A). A row-level calculation - Correct
Row-level calculations operate on each record individually before aggregation.
Tableau documentation specifies that these calculations can be pushed down into the extract and materialized because they do not depend on the visualization or user interaction.
Examples include concatenation, arithmetic, string manipulation, and row-based logic such as:
[Sales] * [Quantity] or IF [Region] = 'West' THEN 1 END
These can be precomputed inside the extract, improving performance.
B). A calculation that contains table calculation functions - Not allowed Table calculations (WINDOW_SUM, INDEX, RUNNING_SUM, RANK, etc.) depend on the table structure after aggregation and query execution.
Therefore, Tableau documentation states they cannot be materialized in extracts.
C). A calculation that contains parameters - Not allowed
Parameters are evaluated at runtime, meaning the user can change their value.
Because of this, Tableau cannot permanently compute and store such a calculation inside an extract.
D). A calculation that contains an aggregation - Generally not materialized Aggregated calculations often depend on query context and cannot always be materialized.
Only simple, context-free aggregations might be materialized, but Tableau explicitly warns that aggregations are not guaranteed candidates for extract materialization.
Thus, this is not the best answer compared to row-level logic.
Conclusion
Only row-level calculations meet Tableau's exact requirements for materialization in extracts.
References From Tableau Consultant Documentation
* Tableau Extract documentation describing materializable calculation types.
* Tableau guidance stating table calculations and parameter-dependent calculations cannot be materialized.
* Extract optimization guidelines describing row-level logic as eligible for materialization.
NEW QUESTION # 52
A client is using the Tableau Content Migration Tool to move content from an old Tableau Server to a new Tableau Server.
Which content will need to be moved using a different tool or process?
- A. Published data sources that use extracts
- B. Workbooks
- C. Published data sources that use live connections
- D. Tableau Prep flows
Answer: D
Explanation:
When migrating content between Tableau servers, certain types of content may require special consideration or different tools for migration:
Tableau Prep Flows: These are specific to Tableau Prep and are not included in the standard content migration capabilities of the Tableau Content Migration Tool. Tableau Prep flows often require separate processes for migration due to their distinct setup and integration with data sources and workflows.
Published Data Sources and Workbooks: These can typically be migrated directly using the Tableau Content Migration Tool, which supports moving published data sources (both live connections and extracts) and workbooks without requiring additional tools.
References:
Tableau Help and Support: Offers comprehensive tutorials and guidelines on using different tools for migrating various types of content, including the specific requirements for migrating Tableau Prep flows which are not covered by the standard content migration tool.
NEW QUESTION # 53
......
Updated PDF (New 2026) Actual Salesforce Analytics-Con-301 Exam Questions: https://www.examtorrent.com/Analytics-Con-301-valid-vce-dumps.html
Verified Analytics-Con-301 Exam Dumps PDF [2026] Access using ExamTorrent: https://drive.google.com/open?id=1CgathzwPOPZk1do31BpuIBRESJm0mIPk
